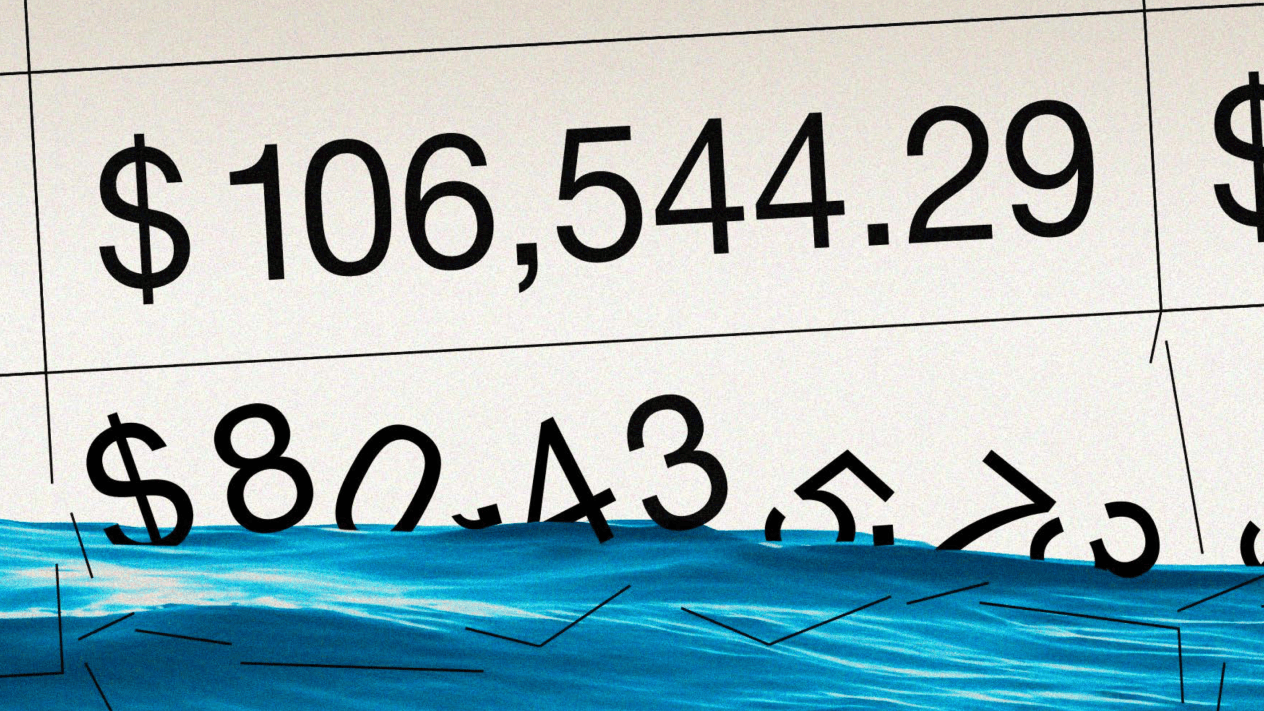
Wastewater compliance cost F&B producers $142M in penalties over the last three years. A third of violators weren't just unlucky—they were chronically noncompliant. This is what's driving it.
IN OUR WORK with food and beverage plants, the first conversation about wastewater treatment is almost always about chemical cost vs performance. How can a facility reduce their spend on chemistry while meeting their KPIs?
But when you dig into a plant’s P&L to build the business case for a chemistry change, other areas start to stand out. Permit violations and non-compliance fees, sludge disposal, labor, production downtime, and even event equipment maintenance are all in-part tied to the chemistry program that a plant uses to treat its wastewater.
When you define cost-to-treat including these details—and can show measurable improvement in each—the case for a better chemistry program becomes much clearer.
With that in mind, I wanted to share what we’ve learned about compliance. Our team has put together a detailed report on F&B facilities by the category of products they produce, geography, and the types of violations triggering compliance costs.
Facility managers & operators will learn how their wastewater treatment stacks up.
Business leaders will learn how the details of wastewater treatment tie to the bottom line.
We’ll also share how chemistry can play a part in reducing or removing compliance issues from your plant’s P&L, and what that looks like in the facilities we’ve worked with.
Key points
Source: EPA ECHO data sets.
According to EPA ECHO data, there are 9,761 food and beverage manufacturing facilities in the U.S. that hold permits under the Clean Water Act’s National Pollutant Discharge Elimination System (NPDES).
25% of facilities had at least one wastewater violation in the last 12 quarters. When these violations are serious or unresolved, they can escalate into enforcement cases where the EPA or a state agency issues orders or settlements that may result in penalties.
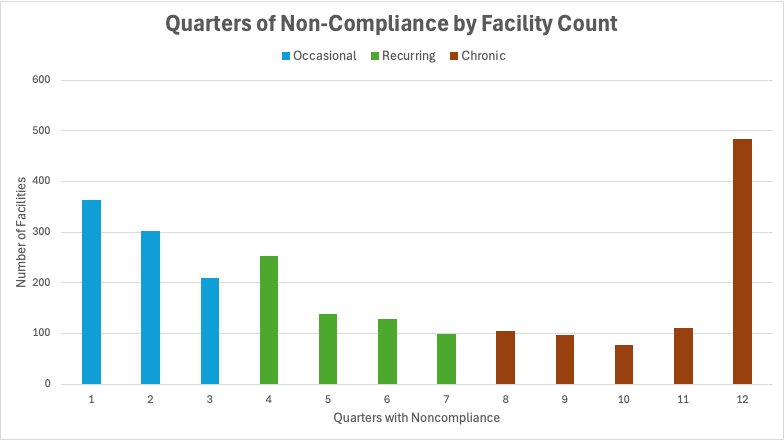
33% of facilities with issues are chronically noncompliant, meaning they had violations in 8 or more of the last 12 quarters. The chart below shows the frequency of of noncompliance in F&B processors, grouping the number of facilities into the corresponding quarters of noncompliance.
Note: Not every F&B facility that manages wastewater will hold a discharge permit. Some are indirect dischargers, sending their treated wastewater to a municipal plant that holds a permit. These facilities cannot be included in the analysis. However, even indirect dischargers must maintain wastewater compliance within KPIs set by municipal partners. Violations incur similar compliance costs passed along from the permit holder.
We grouped producers into categories using NAICS and SIC codes to dig deeper. The chart below shows the number of facilities by category, and the frequency of violations that those facilities had in the last 12 quarters.
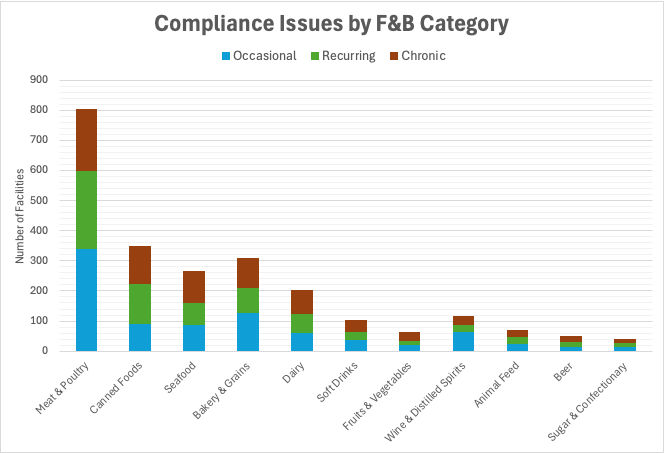
Meat and poultry processors make up the single largest share of facilities in food manufacturing, so they naturally account for the most compliance issues in absolute terms. But measuring by the rate of compliance issues tells a slightly different story.
Here’s the same data adjusted for the number of facilities operating in that category.
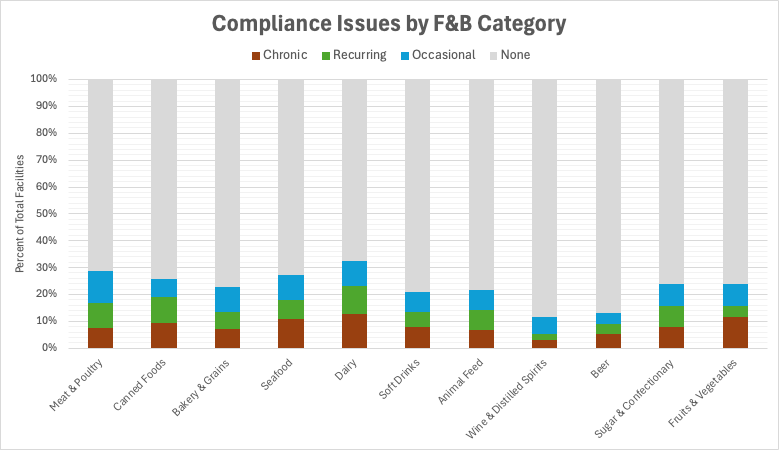
While the gap between categories only varies by a few percentage points, it compounds across hundreds of facilities. That difference translates into dozens more plants facing compliance issues, underscoring that certain production processes carry a structurally higher risk profile.
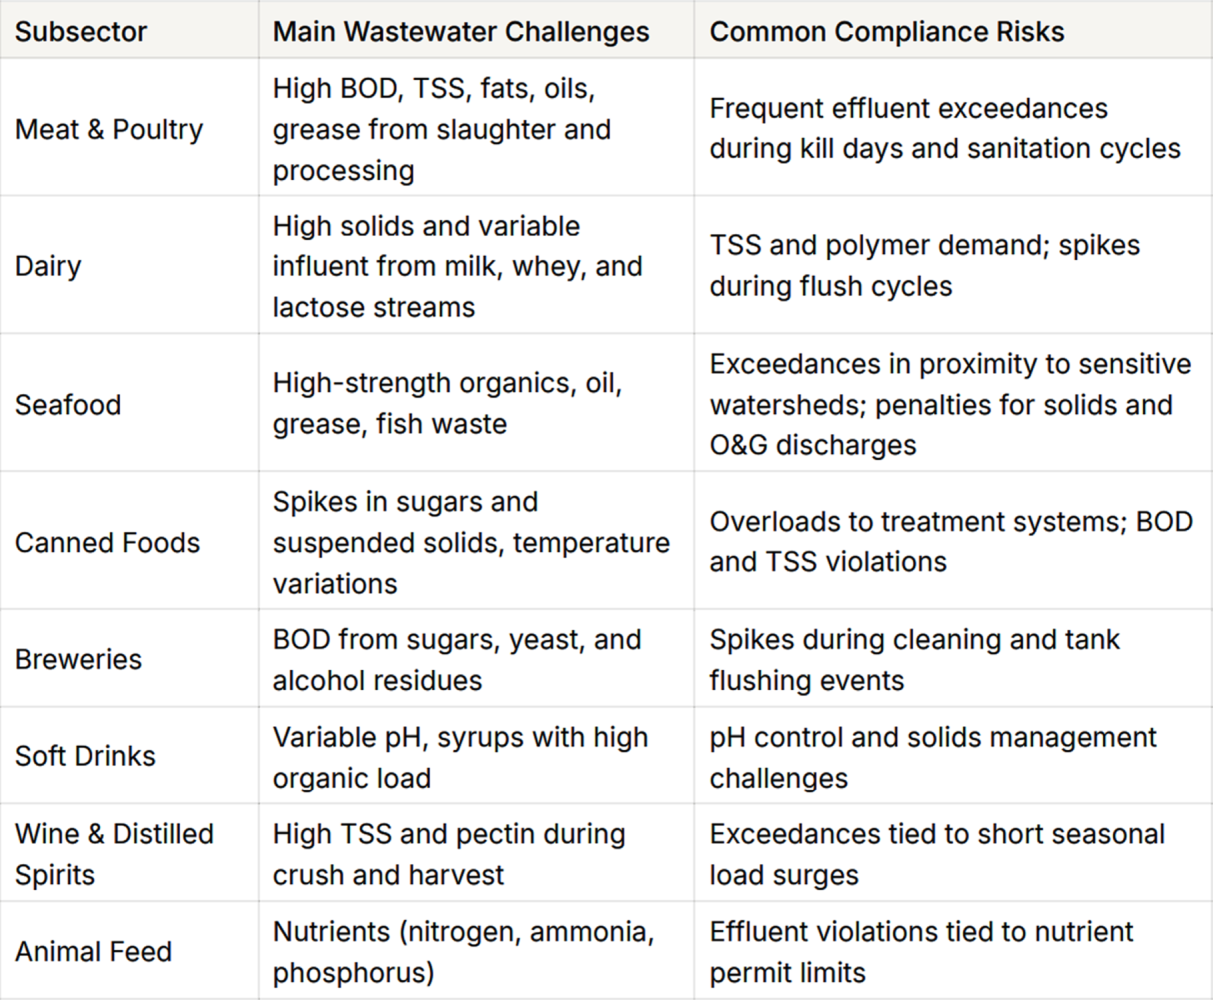
Each type of food and beverage facility faces unique wastewater challenges tied to its raw materials, production cycles, and treatment infrastructure. For example, fats and proteins in meat, sugars in beverages, and nutrients in animal feed.
The table below adds context to the previous figures, outlining the typical wastewater characteristics for each subsector and the compliance risks most often associated with them.
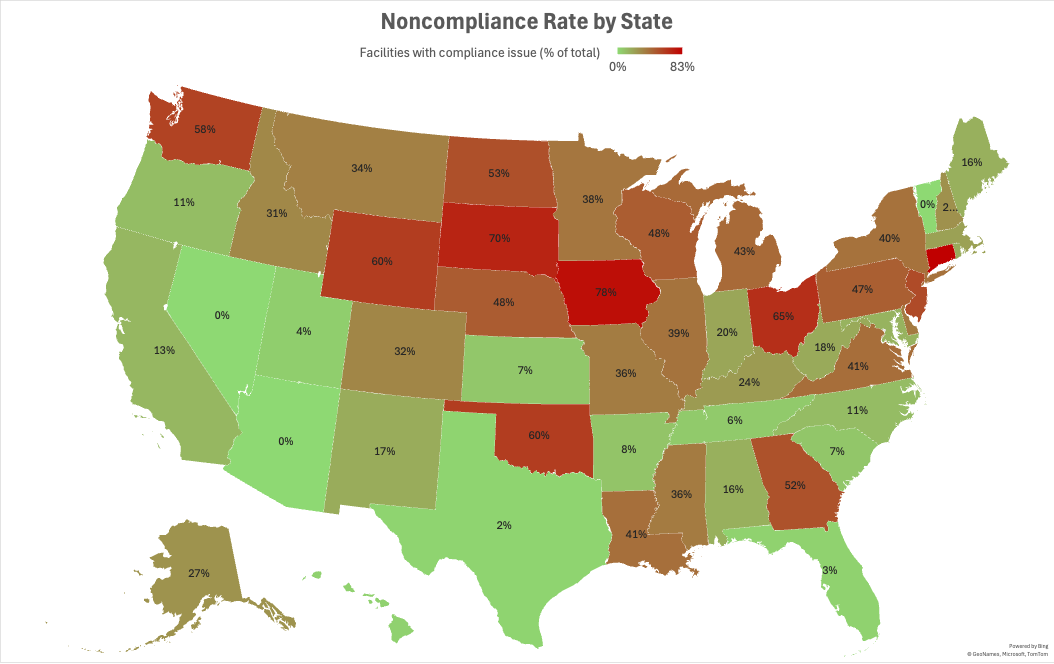
NPDES permits are issued at the state level (with EPA oversight), and the specific limits can be more or less stringent depending on local water quality standards. Two otherwise similar facilities may face different compliance burdens simply because one state enforces tighter limits on nutrients, solids, or organics.
The chart below shows the rate of noncompliance across the US, adjusting for the number of facilities operating in that state.
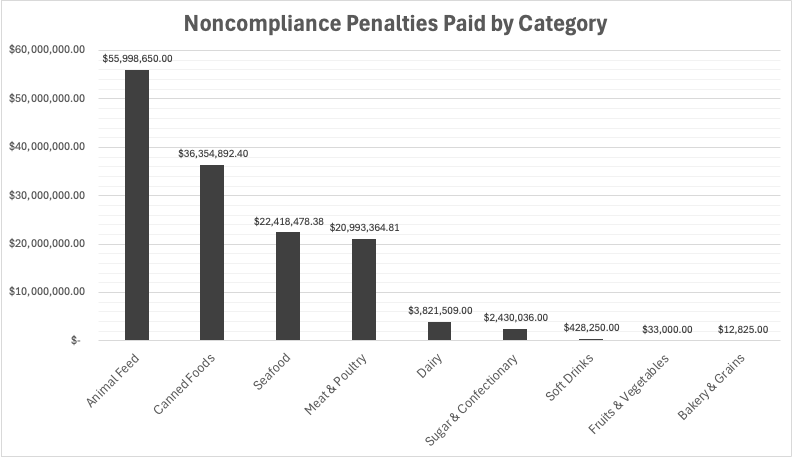
Enforcement case records show approximately $142 Million in penalties were collected over the last twelve quarters for wastewater related violations. Some businesses paid as much as $30 million. Here’s how those penalties were spread across producers by category.
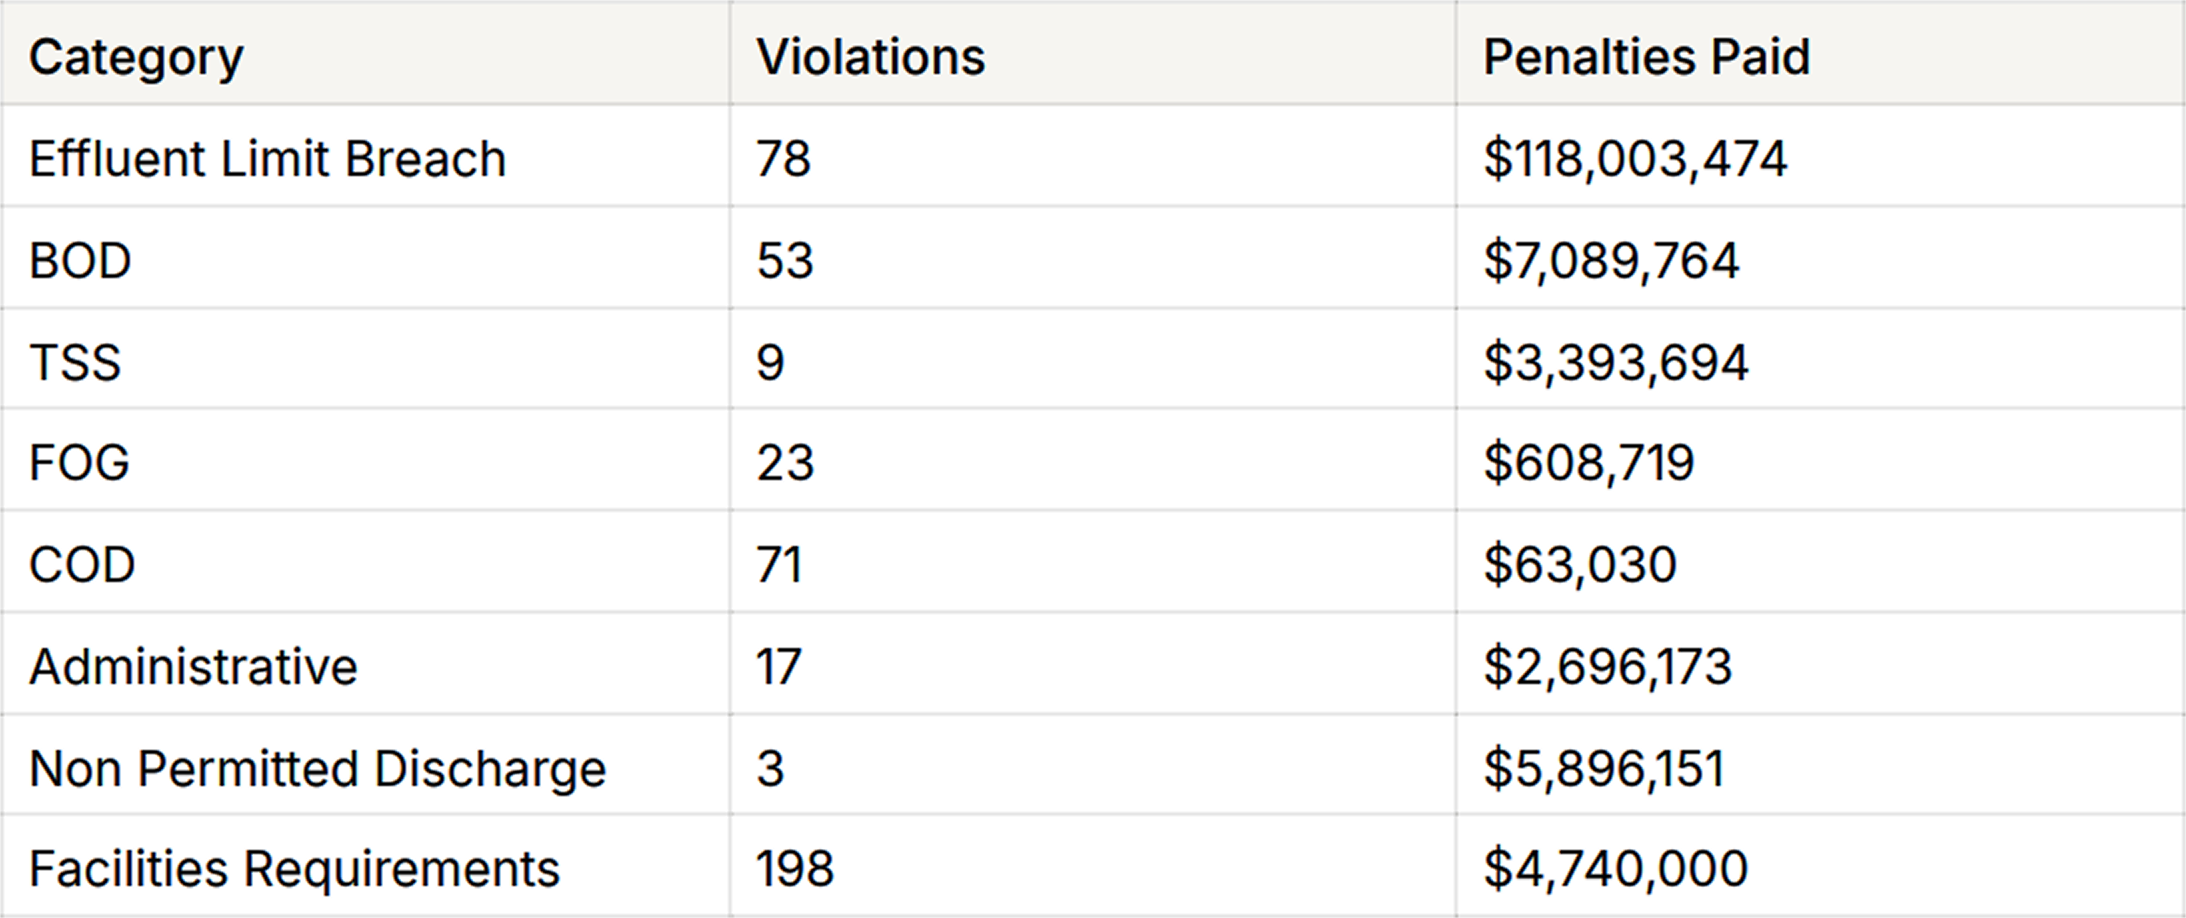
Most violations are administrative (late reports, permit filing issues) and rarely result in significant financial penalties. By contrast, effluent exceedances tied to pollutants like BOD or nutrients occur less frequently but drive much higher costs.
The chart below shows more detail on the type and frequency of violations, as well as the associated penalties paid. Interestingly, violation counts and penalty dollars don’t move in lockstep.
Effluent breaches make up 83% of the $142M in penalties paid. More than every other category combined.
Each category of producer is faced with a unique set of challenges. The chart below shows penalties paid by each category of F&B producer in the last 12 quarters.

Across subsectors, penalties concentrate on a handful of pollutant categories. Nutrients like nitrogen and ammonia dominate the Animal Feed sector, while oil, grease, and suspended solids account for most penalties in seafood and beverage production. Other pollutant categories such as metals or pH excursions appear in the records but represent a smaller share of total penalties paid. The dataset makes clear that understanding which parameters regulators enforce most aggressively in a given subsector is critical for risk management.
The penalty data shows significant state-by-state variation. Alaska, for example, accounts for a disproportionate share of penalties compared to its number of facilities, with seafood processors driving most of the violations.
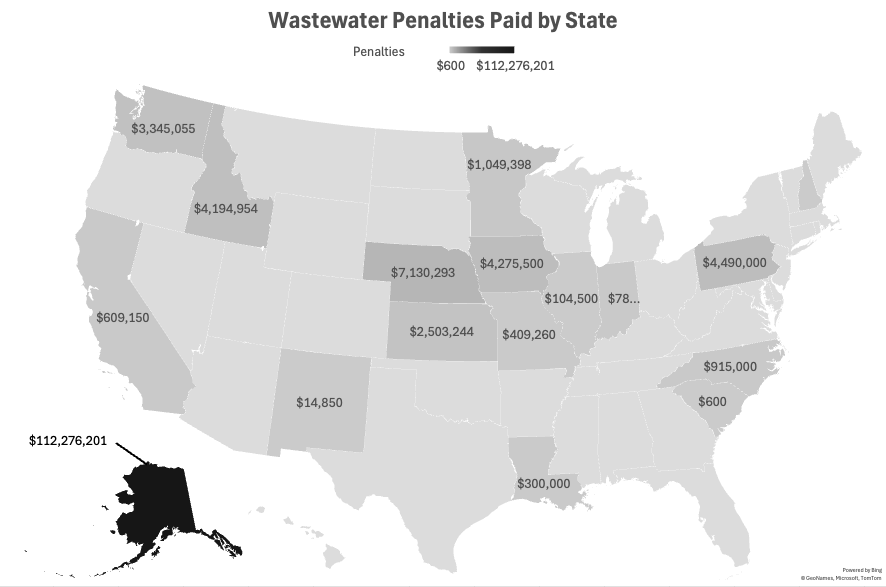
States with sensitive receiving waters like coastal zones, fisheries, or drinking water reservoirs often see higher penalties for similar violations. In Alaska, seafood solids and oil & grease are heavily penalized because of the risk to fisheries.
Business leaders should be aware of these wastewater treatment nuances and work with facility leaders to account for the unique risks (and associated costs) appropriately.
Nearly all food and beverage facilities runs a different version of the same process: screens, tanks, pumps, and DAFs moving water through physical, chemical, and biological steps. These systems are designed for an average load. However, flushes, harvests, and sanitation cycles can double or triple the solids and organics entering a system overnight. When that happens, even well-designed infrastructure hits its limit.
That’s why effluent breaches, the alphabet soup of failed KPIs (TSS, BOD, COD, FOG) accounts for 97% of penalties.
From an operator’s standpoint, an effluent breach signals that the treatment program (primary separation, DAF, biological systems, or dewatering) did not perform as designed under real operating conditions. Sometimes it’s a design limitation like the plant being undersized for peak load. But it’s also a function of day-to-day process reliability like inconsistent chemistry, overloaded clarifiers, or poor solids capture.
Chemistry is the flexible lever operators can pull without changing infrastructure. If coagulants or flocculants aren’t optimized for the specific influent profile, spikes in TSS, BOD, or FOG push the plant out of spec. Poor-performing or “legacy” polymer programs may work under average loads but fail during flushes, seasonal swings, or high production runs. When breaches tend to happen.
Conversely, well-matched chemistry stabilizes performance, extends the capability of existing assets, and reduces the likelihood that routine production variability escalates into a reportable violation.
The analysis shows a consistent pattern: most penalties in food and beverage wastewater come from effluent exceedances tied to BOD, TSS, nutrients, fasts, oils, and grease.
Chemistry programs have the potential to change the risk and cost profile for a facility. Stronger coagulation and flocculation programs stabilize influent variability, keep downstream processes within design limits, and cut down on the spikes that turn into violations and penalties.
The view below illustrates that impact: the same facility, facing the same loads. One uses a legacy chemistry program which requires higher doses and still struggles to meet KPIs. The other with a treatment program capable of holding effluent quality inside permit limits instead of drifting into non-compliance.


Amielle Lake previously founded Tagga, sold to Campaign Monitor, and is a founding member of the Women’s Equity Lab, an angel investment group launched to support Canadian entrepreneurs. At CarboNet, she built the team that swept the Permian Basin, taking SimpleFloc from alpha to market dominance in just two years.
© 2023 CarboNet. All rights reserved